
Quant-Driven Strategy
An Algorithmic Trading System Built for Discipline and Risk Control
IMPORTANT: Decentralized Masters provides automated trading software only. We do not offer investment advice. All trading decisions and outcomes are solely your responsibility.

“Decentralized Masters is the gold standard of DeFi education.”

.avif)
Randy S.

“The best financial decision I’ve made in 8 years.”

Joseph B.

SYSTEM ARCHITECTURE
What Sets Our Trading Algorithms Apart?
For investors seeking disciplined, data-driven tools to navigate cryptocurrency markets with defined risk parameters.
Consistency Focused
70% Win Rate During Backtesting
BACKTESTED RESULTS ONLY - NOT LIVE TRADING
This reflects the percentage of trades that closed profitably using the bot's most conservative configuration during our 208-day historical testing period. Focused on consistency over outsized wins.
IMPORTANT: This is backtested data using historical market data. Backtesting does not include real-world factors such as slippage, exchange fees, API delays, or execution costs. Live trading results will differ from backtested results, potentially significantly.
Tested Over Time
208 Days Tested Across Multiple Market Conditions
The trading bot has been backtested over more than 200 days of historical data, spanning different market environments including volatility spikes, pullbacks, and trend shifts.
Backtested across multiple market conditions during the testing period using historical data.
Backtested across multiple market conditions during the testing period using historical data.
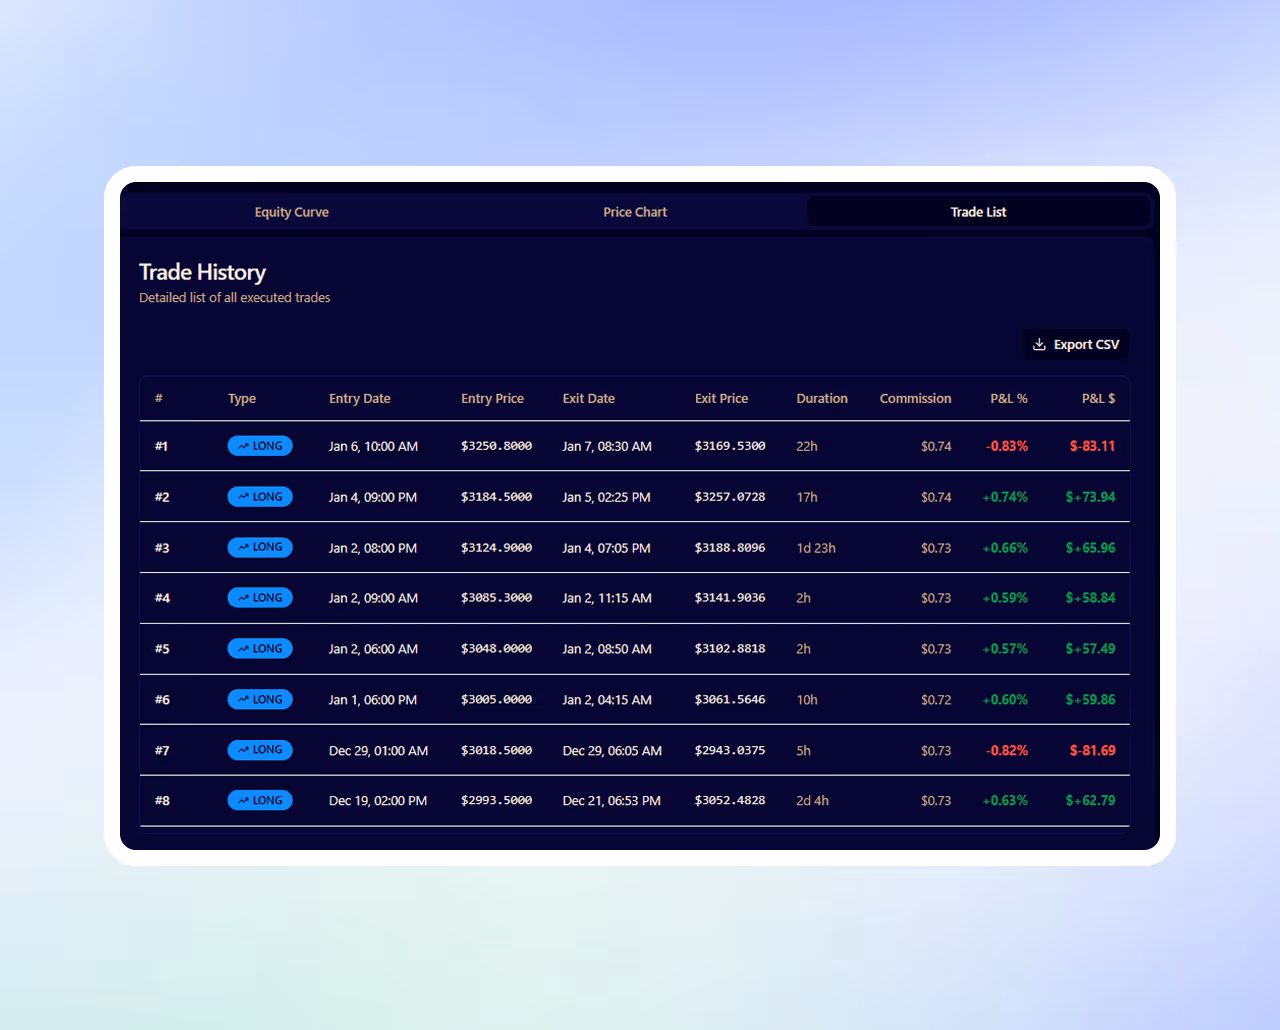
Transparent Execution
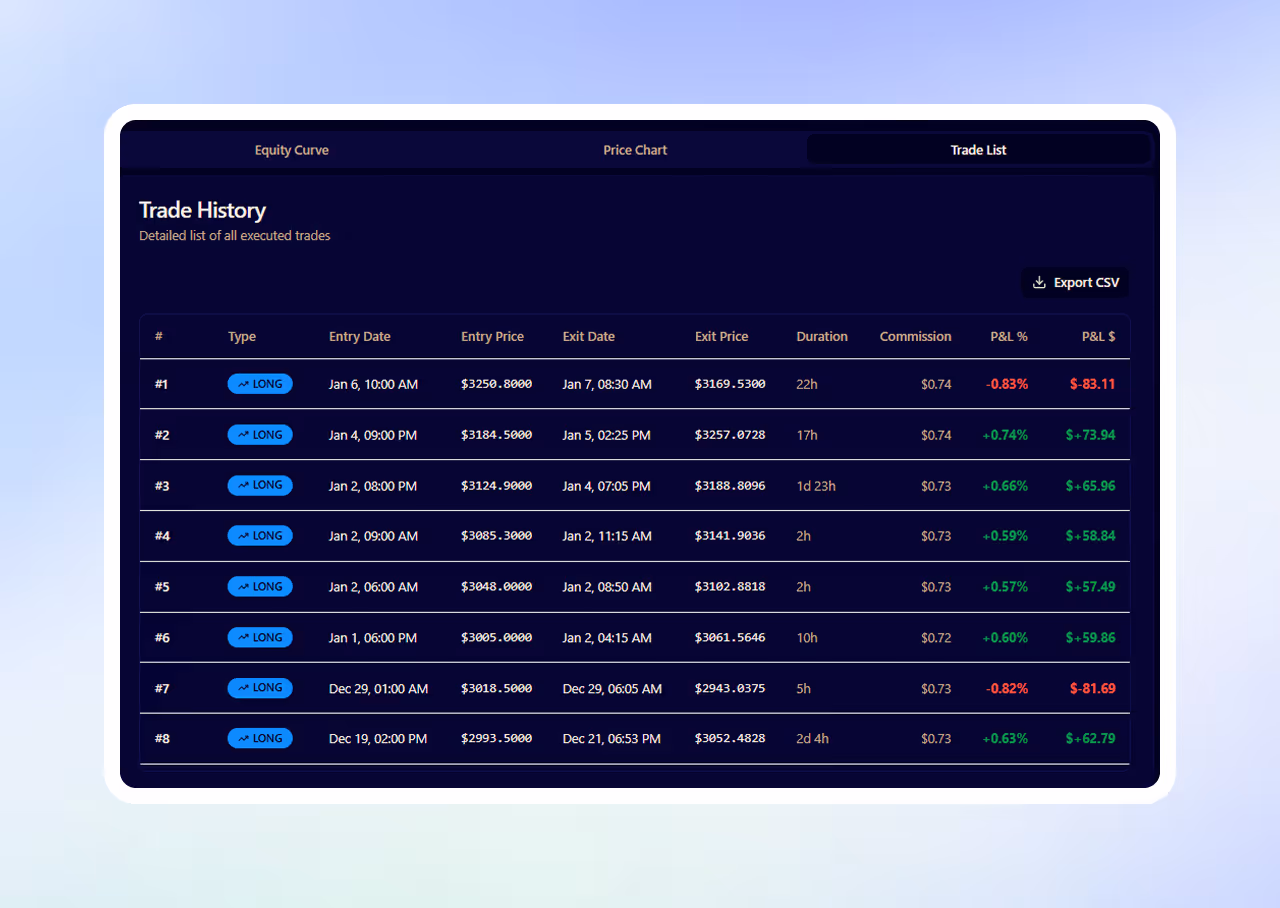
121 Logged Trades with Fully Documented Entry & Exit
Every trade executed during testing is logged with clear entry and exit criteria, allowing for full transparency into how decisions are made.
This ensures the system is rule-based, repeatable, and auditable - not discretionary or emotion-driven.
This ensures the system is rule-based, repeatable, and auditable - not discretionary or emotion-driven.
Efficiency Metric
Profit Factor > 2 (Backtesting)
During backtesting, the system generated a profit factor above 2, meaning profits exceeded losses by more than 2:1 during the testing period.
This is a backtested risk-adjusted performance metric emphasizing efficiency and capital preservation rather than raw return alone. Backtested results do not guarantee live trading performance. Live results will differ.
This is a backtested risk-adjusted performance metric emphasizing efficiency and capital preservation rather than raw return alone. Backtested results do not guarantee live trading performance. Live results will differ.
Self-Custody
Your Funds Stay With You
The software executes trades automatically based on rules and parameters you configure. You maintain complete control - you select the strategy, set all parameters, and can start, stop, or modify the bot at any time. We cannot withdraw, transfer, or access your funds.
You maintain full custody of your assets at all times through your own exchange account.
You maintain full custody of your assets at all times through your own exchange account.
Disclosure: Trading digital assets involves substantial risk, including the potential loss of all invested capital. Digital asset markets are volatile, unregulated in many jurisdictions, and subject to sudden price movements, liquidity constraints, technical failures, and regulatory changes.This software is intended for users who understand these risks and are capable of making independent financial decisions. You should not trade with funds you cannot afford to lose.
Structured Edge
Designed to Address Emotional Trading Decisions
Manual trading creates emotional pressure and inconsistency. This bot replaces that chaos with calm, rules-based execution.
🔴 The Problem
Why Manual Trading Becomes Exhausting

Overtrading driven by fear or excitement
Emotional decision-making under pressure
Inconsistent results from changing strategies
Constantly second-guessing entries and exits
Hours lost watching charts and managing trades
Even experienced traders struggle to execute perfectly - every day.
🔵 The Solution
What the Bot Changes

Rules-based execution removes emotion entirely
Trade cadence based on predefined rules
Rule-based trade entries and exits
Trades are executed according to predefined logic
Trades run automatically without constant monitoring
A system designed to trade calmly - even when markets aren’t.
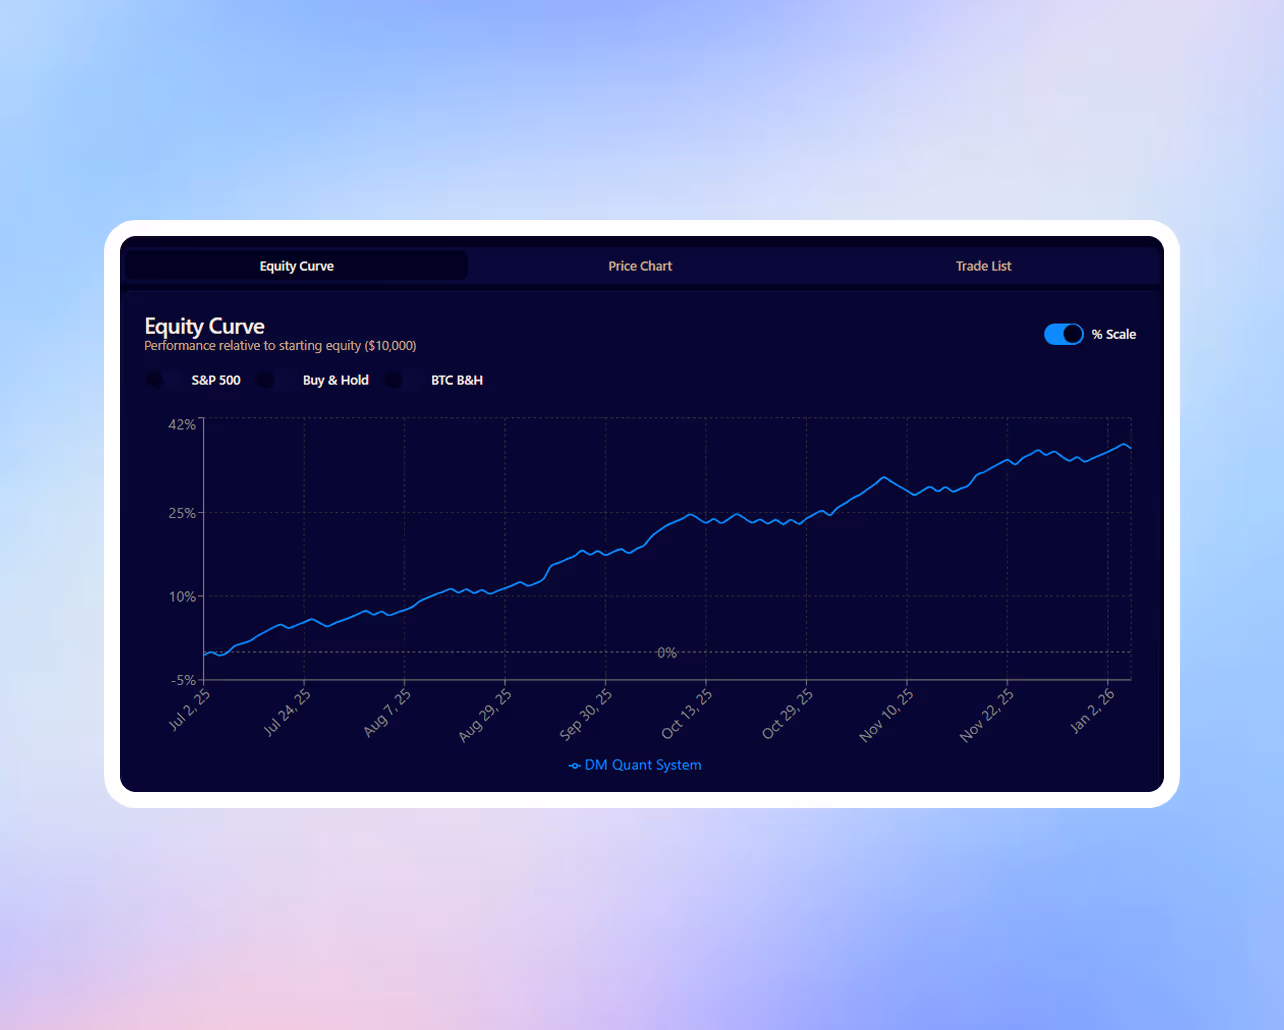
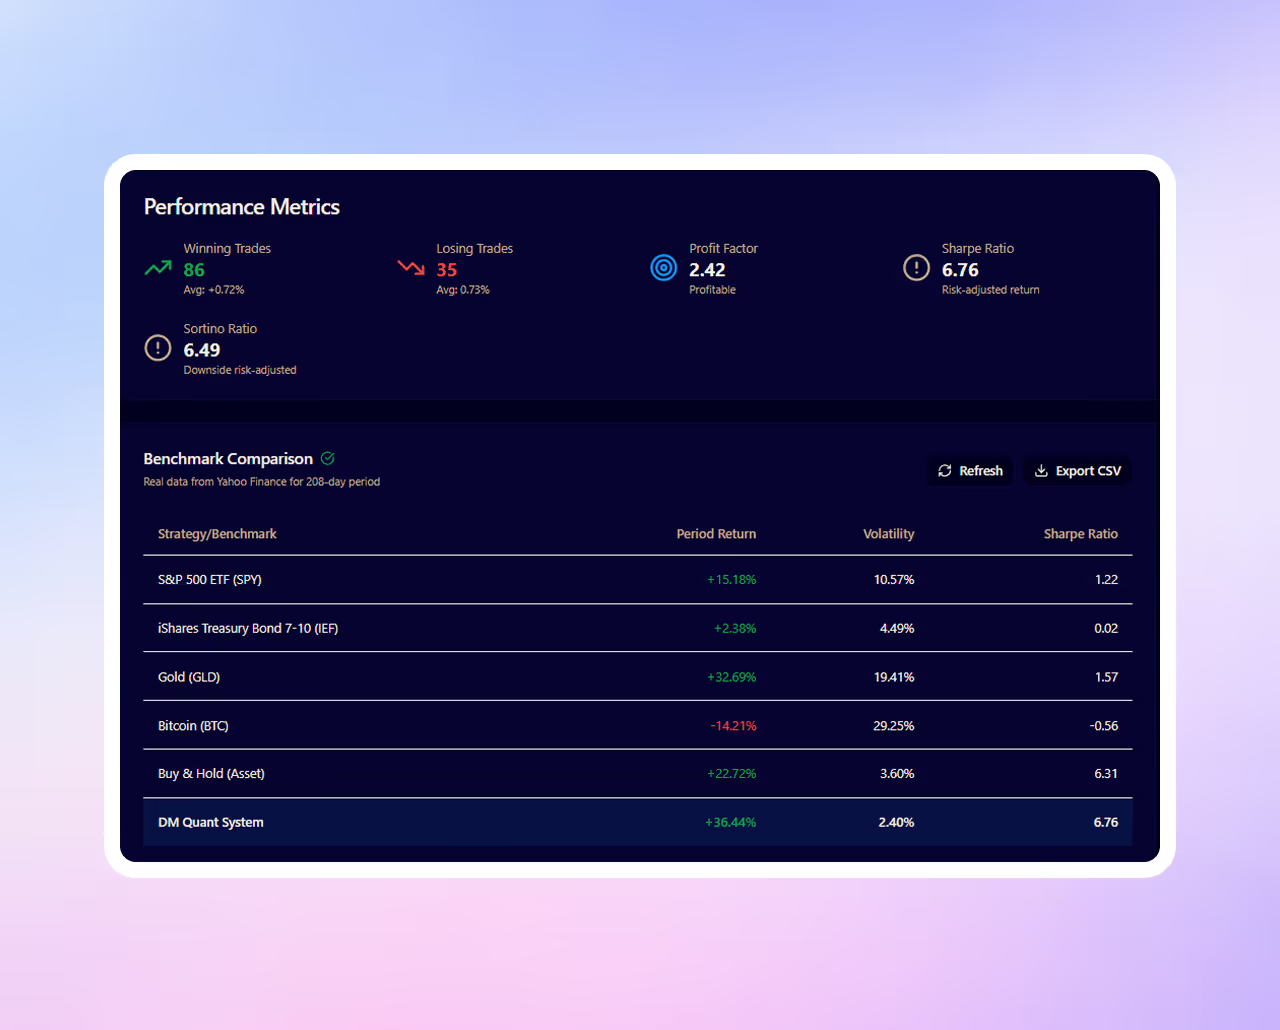
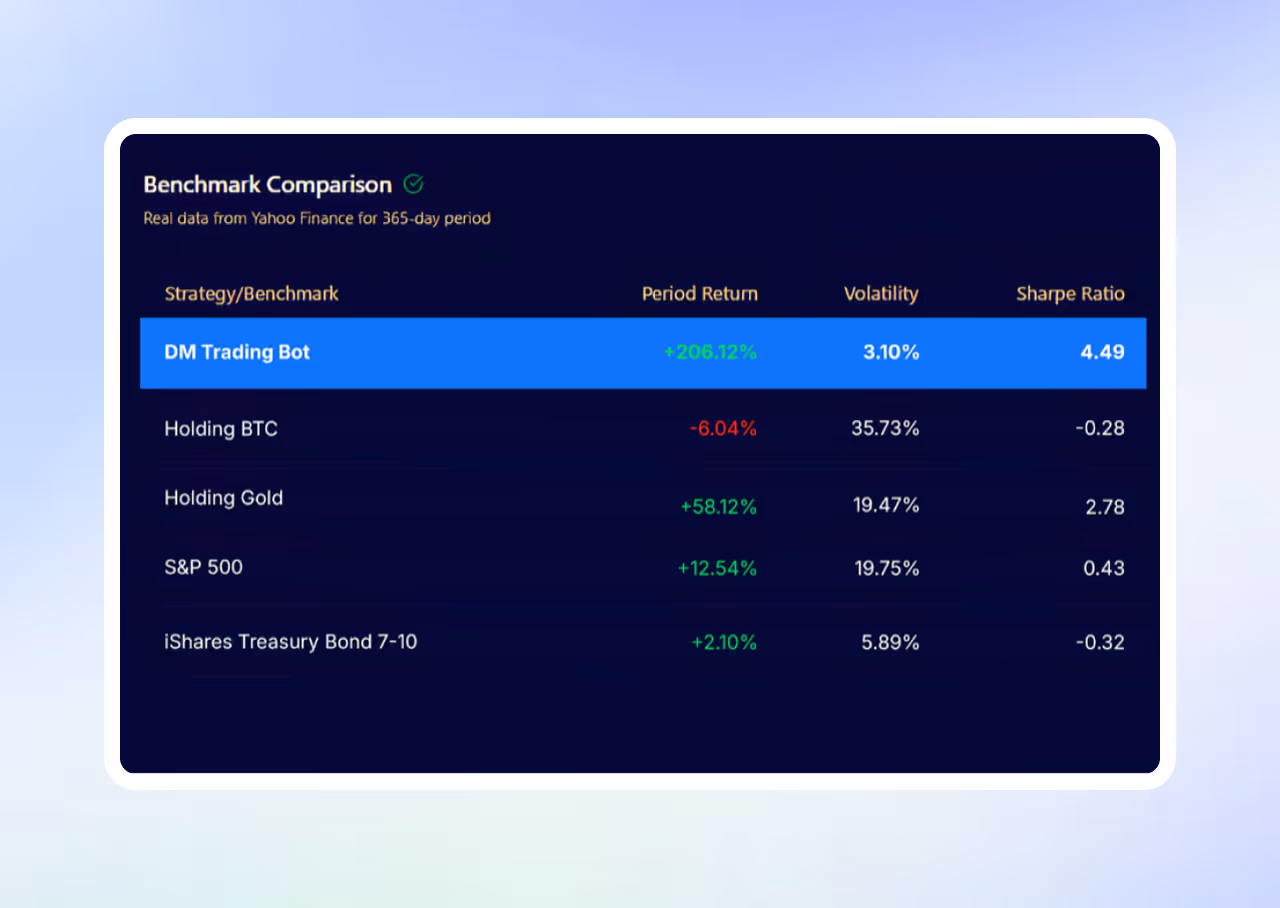
PERFORMANCE METRICS
How the Strategy Performed During Backtesting
Key risk-adjusted metrics observed during 208-day historical backtesting using conservative default settings. These are backtested results only.
2+
Profit Factor
Generated more than two units of return for every unit of risk during testing.
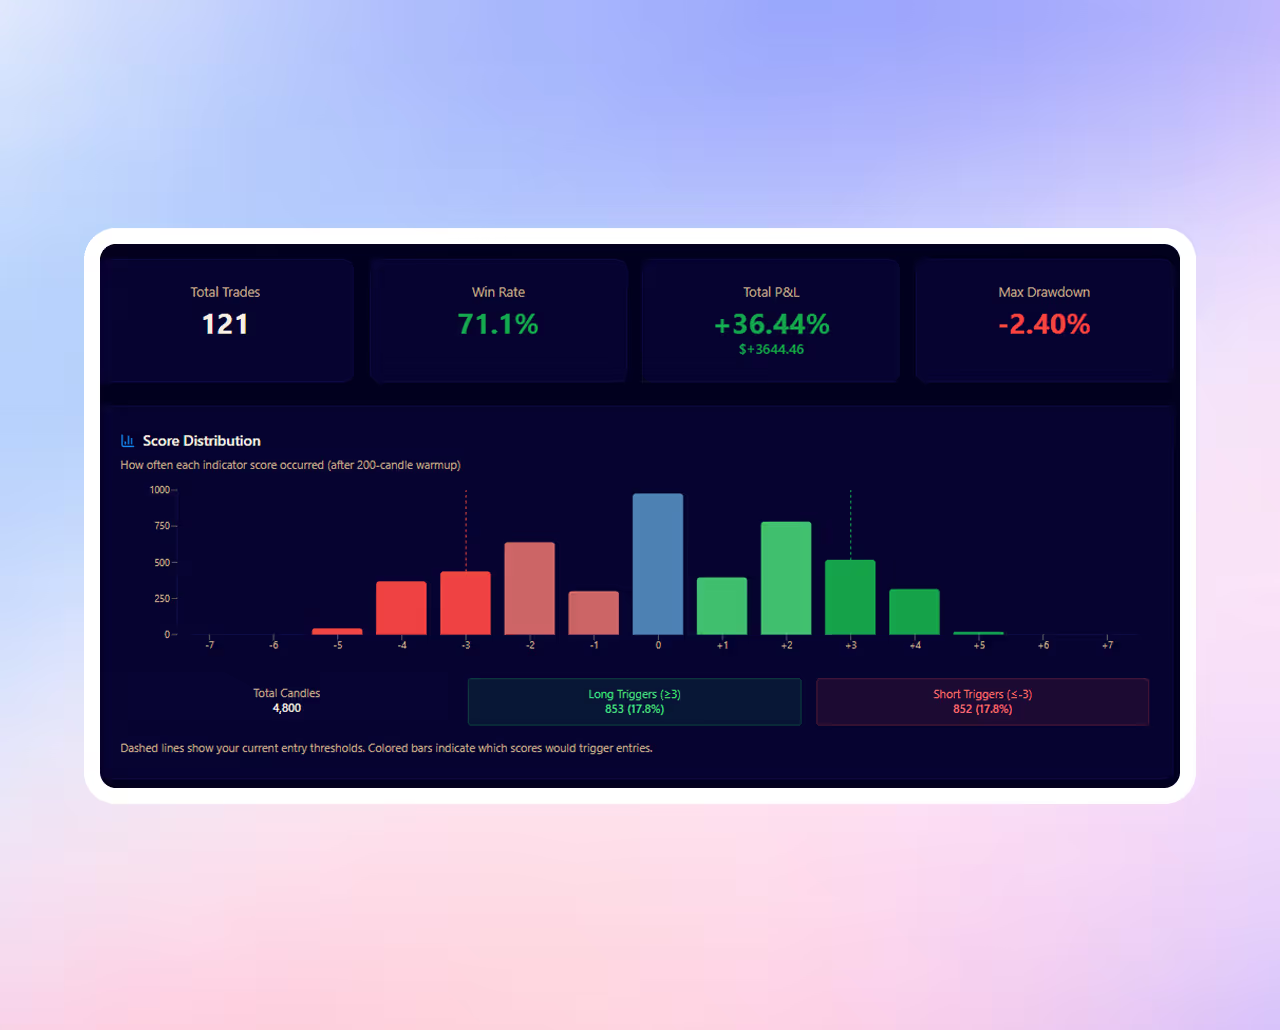
70%
Win Rate
About 7 out of 10 trades closed profitably during testing.
~6
Sharpe Ratio (Backtesting Only)
Observed in historical simulations. Not representative of live trading. Real-world results will vary significantly.
Disclosure: Trading digital assets involves substantial risk, including the potential loss of all invested capital. Digital asset markets are volatile, unregulated in many jurisdictions, and subject to sudden price movements, liquidity constraints, technical failures, and regulatory changes.This software is intended for users who understand these risks and are capable of making independent financial decisions. You should not trade with funds you cannot afford to lose.
Risk Spectrum
You Choose Your Strategy - You Control Your Risk
Select from multiple pre-built strategy configurations or customize parameters to match your personal risk tolerance. You decide when to start, stop, or modify the bot at any time.
🟢 Conservative
Lower-volatility configuration
Designed for those who prioritize capital preservation and stability over aggressive growth.
Lower volatility bias
Tighter risk controls and position sizing
Focused on consistency and downside protection
Historically smaller drawdowns during testing
Designed for users who prioritize capital preservation and risk control over aggressive growth potential. Tighter risk controls and lower volatility exposure.
🟡 Moderate
Dynamic execution settings
Designed for users seeking a balance between opportunity and protection.
Adaptive position sizing
Moderate volatility exposure
Rules-based guardrails to manage downside risk
Seeks to participate in upside while maintaining risk awareness
Ideal for those comfortable with some volatility in pursuit of balanced performance.
🔴 Aggressive
Volatility-Aware Exposure
Designed for experienced users who understand and accept higher levels of volatility.
Momentum-driven configurations
Higher volatility and drawdown potential
Increased exposure during favorable market conditions
Requires strong risk tolerance and discipline
You select this strategy based on your own risk assessment and understanding of higher volatility exposure.
STRATEGY ENGINE
Test. Tune. Deploy - With Confidence
Validate strategies using historical data and fine-tune parameters before going live - built for beginners, powerful enough for pros.
BACKTESTING ENGINE
Validate Before You Deploy
Test strategies against historical market data to evaluate how they would have behaved under real market conditions - before deploying any capital.
No Real Capital
Test strategies using historical data before deployment
Historical Data
Simulate real market conditions before deploying
TESTED & REFINED
Built Through Real Market Cycles
The strategy has been tested over 6 months across varying market environments using historical data and rule-based execution.
Market-Tested
Validated across multiple market conditions during the testing period
Rules-Based
Executes trades using predefined logic without emotional decision-making
Disclosure: Trading digital assets involves substantial risk, including the potential loss of all invested capital. Digital asset markets are volatile, unregulated in many jurisdictions, and subject to sudden price movements, liquidity constraints, technical failures, and regulatory changes.This software is intended for users who understand these risks and are capable of making independent financial decisions. You should not trade with funds you cannot afford to lose.
Got Questions? We’ve Got Answers.
Quick answers to questions you may have about the DM Trading Bot
Is this investment advice?
No. Decentralized Masters is a software provider, not an investment advisor. We provide tools; you make all trading decisions. Consult a licensed financial advisor for personalized investment advice.
Can you access my funds?
No. Our software connects via API to execute trades you've pre-authorized based on your selected parameters. We cannot withdraw, transfer, or access your exchange balance.
Am I in control of the bot?
Yes. You have complete control at all times. You independently select your trading strategy, configure all parameters, decide when to activate or deactivate the software, and can modify settings at any time. The software is a tool that automates execution of YOUR trading rules - it does not make decisions for you or provide recommendations. You are solely responsible for all configuration choices and trading outcomes.
What happens if I lose money?
All trading involves risk of loss, including loss of your entire trading capital. Decentralized Masters is not responsible for trading losses. You assume full responsibility for all trades executed through the software.
What if the software malfunctions or fails?
Automated trading software can experience technical issues including connectivity problems, API failures, coding errors, exchange downtime, or execution delays. These issues may result in missed trades, incorrect executions, unexpected positions, or financial losses.Decentralized Masters provides the software “as-is” without warranty of any kind. We are not responsible for losses resulting from software malfunctions, third-party service failures, or technical issues. Users should monitor their accounts regularly and understand that automated systems are not infallible.
You acknowledge that you understand these technical risks and accept full responsibility for monitoring your account and trading activity.
You acknowledge that you understand these technical risks and accept full responsibility for monitoring your account and trading activity.
Is the 70% win rate guaranteed for my live trading?
No. The 70% win rate is a backtested metric from 208 days of historical testing. Backtesting does not include real-world factors like slippage, exchange fees, execution delays, or changing market conditions. Live trading results will differ from backtested results, potentially significantly. Past performance does not guarantee future results. All trading involves substantial risk of loss including loss of all capital.
Can I start and stop the bot at any time?
Yes. You have full control to start, stop, pause, or modify the bot's parameters at any time. You decide when the bot is active and when it is not. The software executes trades only when you have it running and only according to the parameters you configure.
What exchanges work with this bot?
You must have an account with a supported exchange. The bot connects via API to execute trades in your exchange account based on your configured parameters.
Do I need coding or technical knowledge to use this?
The bot comes with three pre-configured strategies (Conservative, Moderate, Aggressive). No coding is required to use these pre-built configurations. However, basic understanding of trading concepts (risk management, position sizing, stop-losses) is important for responsible use. The software provides tools for execution; you remain responsible for all trading decisions and outcomes.